Help Center: Dashboard
The Native AI dashboard gives you a holistic view of your products, competitors, and market trends. Jump to section:
Your Brand Overview
This section contains 3 charts: Total Reviews, Sentiment Over Time, and Sentiment Breakdown.
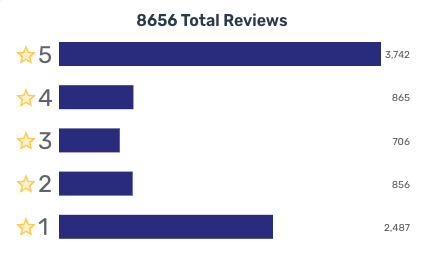
- Total Reviews displays the total number of reviews tracked within the Native AI platform, broken down by star rating.
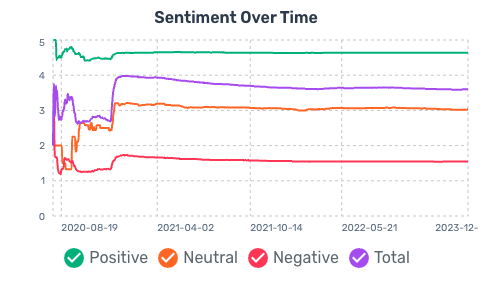
- Sentiment Over Time displays the average star rating of reviews containing positive, negative, and neutral sentiment. Our Natural Language Processing model will detect sentiment based on contextual clues within the review text. It is considered optimal if the purple line (total) hovers between green (positive) and orange (neutral). If the purple line approaches the green line, average sentiment is increasing. If the purple line approaches the red line, average sentiment is decreasing.
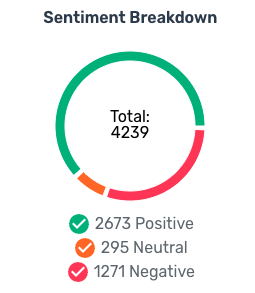
- Sentiment Breakdown displays the volume of reviews containing positive, negative, and neutral sentiment statements.
To add additional data sources, navigate to Catalog -> New Product.
These charts will update every day, and will include as much historical information as allowed by each data source. Each data source has differing API access limits. For example, Amazon does not allow for very long-term storage of reviews, while other retailers may have longer data retention limits.
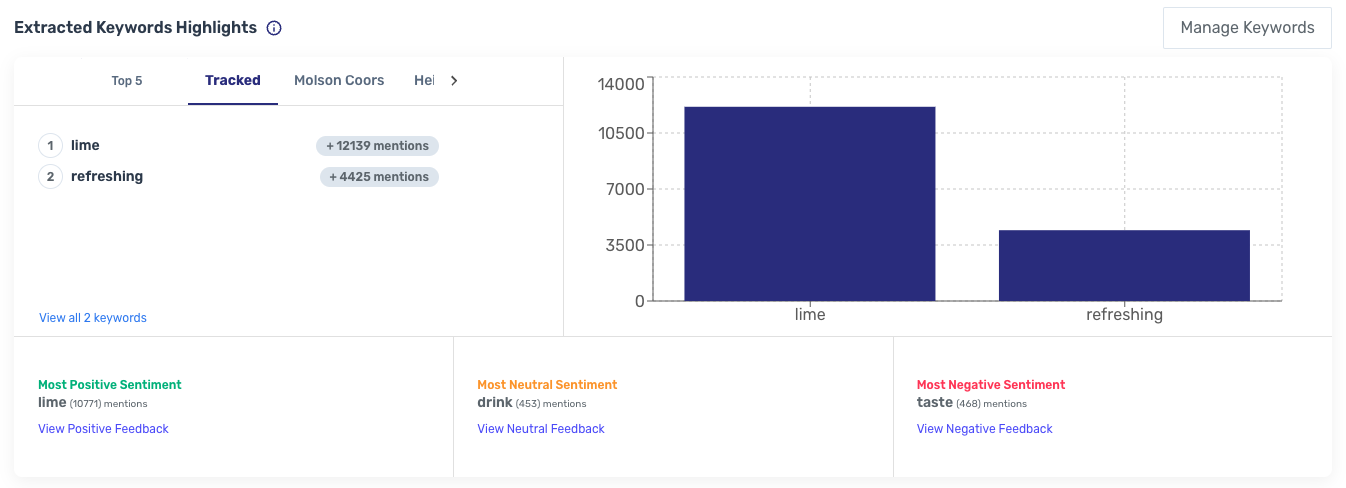
Extracted Keywords Highlights
Extracted Keywords Highlights surfaces the most common words and phrases used in any online and uploaded data set. Unless filters are applied, this will display extracted keywords across all combined online + uploaded data sets.
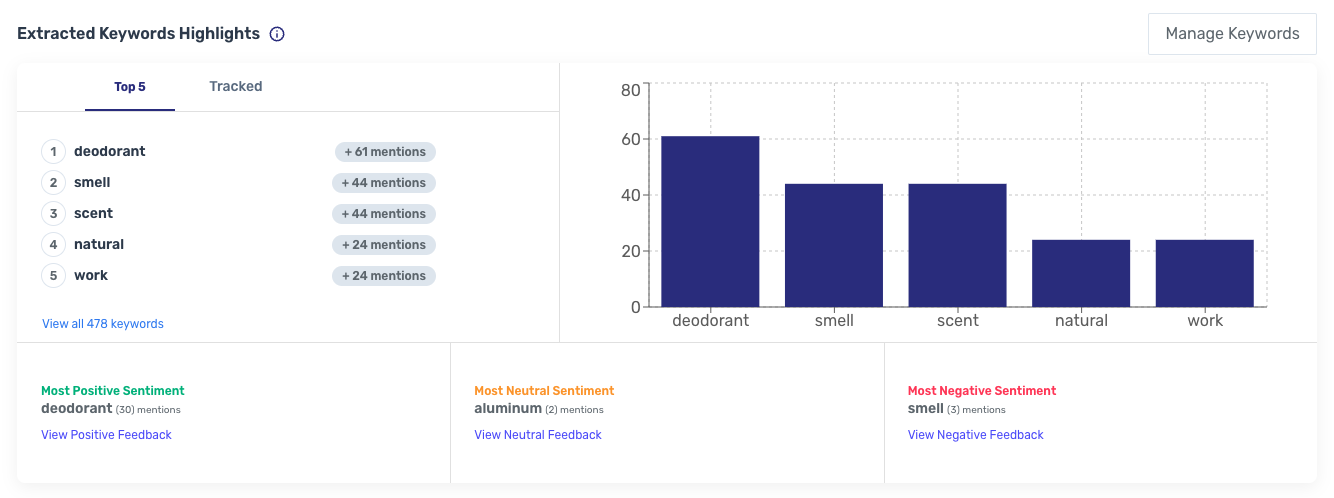
Our Natural Language Processing engine will automatically surface common keywords, but you can also add new keywords to track (or ignore certain words and phrases) using the Manage Keywords function. Common applications of using custom Keywords:
- monitoring the impact of changing a recipe or design
- monitoring perception shift resulting from a recent or ongoing marketing campaign
- identifying common areas of high or low market satisfaction for new product opportunities
You can save keywords from your own products to the 'Tracked' tab. If you create Watchlist Product Groups, extracted keywords for those products will automatically appear as separate tabs to the right of the 'Tracked' tab. For example, in the screenshot below, 'Molson Coors' is a Watchlist Product Group.
Quality IQ Overview
Quality IQ is a proprietary metric that uses Natural Language Processing to score products based on positive/negative/neutral sentiment and the strength/conviction of that sentiment based on contextual clues. A higher Quality IQ score means that customers mention that attribute in a strongly positive way, while a low Quality IQ score means that customers mention that attribute in a strongly negative way.
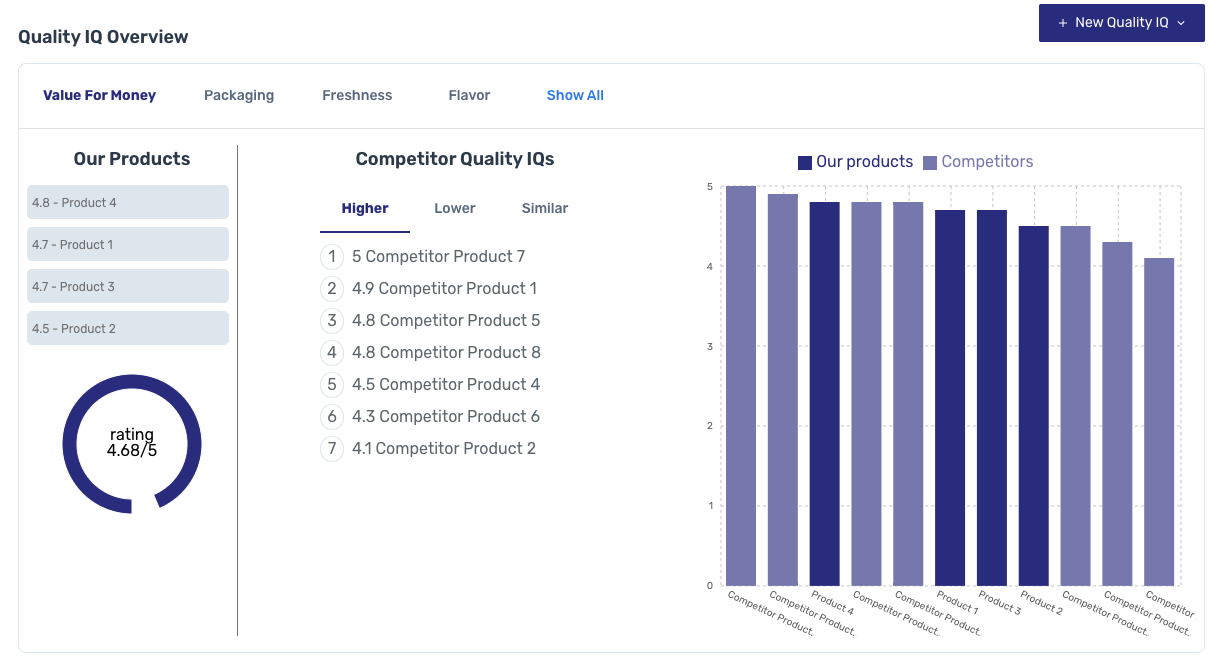
Quality IQ will score each of the products you've added via the Product Catalog and (competitor) Watchlist. It's a best practice to include at least 2 different competitors for competitive benchmarking purposes. We recommend a ratio of 1:3, with 3 competitive products for every 1 owned product.
Remember that each distributor will have a slightly different customer base, so you should treat the same product across 2 different distributors separately.
You can customize your Quality IQs with the 'New Quality IQ' button.